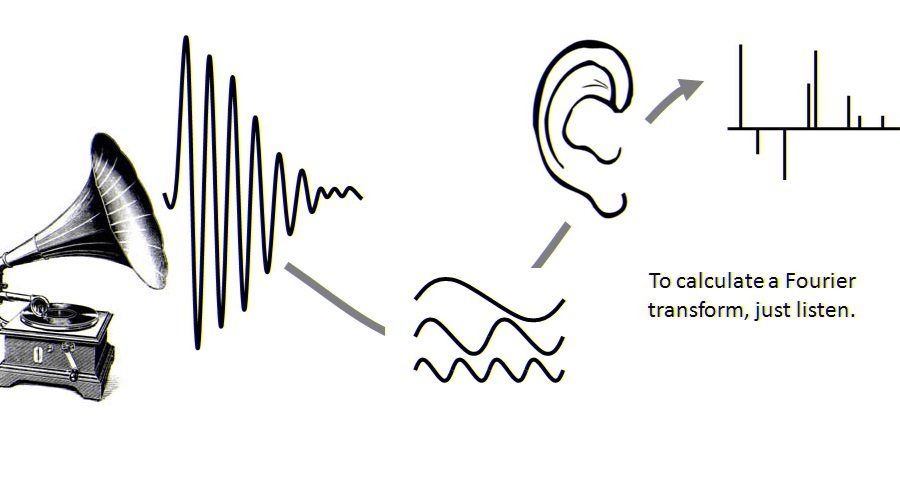
The ear formulates a mathematical transform by converting sound – the waves of pressure travelling through time and the atmosphere – into a spectrum, a description of the sound as a series of volumes at distinct pitches. The brain turns this information into perceived sound, see [Bracewell, 1989].
Through this article, let us try to understand the central mathematical ideas of this transform we call hearing. Hereby, we start with Fourier’s main idea, that principally any function/ wave can be described by a superposition of sine and cosine waves. This means that any sound, which is per se a pressure wave over time (energy/ amplitude per time), is a sum of easy to handle sine functions. In most cases this sum will be indefinite, which raises the question of whether this description of a physical situation is well defined or just a mere humbug. Interestingly enough, when the mathematical community itself heard about Fourier’s description of functions by infinite sums of sinusoidal waves and that he was able to resolve even discontinuous functions to a remarkable high degree of precision, i.e., functions that had some jumps in their graphs (e.g., a saw-tooth or a rectangular wave), was believed to be impossible.
Next, as we know that sound is indeed just a combination of sine-functions, we can assign each sine-function and therefore the original sound to a distinct energy or power spectrum which gives us the energy/ amplitude per frequency. This process is called Fourier transform. Thus, we gain a description of the sound as a series of energies at distinct pitches, which then can be viewed as the stimuli for our brain cells. En passant, we solve the Beatles “on a hard day’s night” chord mystery.
Last, we will discuss the application of Fourier analysis to de-noise audio transmissions and to store data, as in particular the popular MP3-audio-format is just a smart technical implementation of the Fourier transformation.
Well, let us go into the details and illustrate further the superposition of waves by sine functions.
Fourier’s Idea – Everything is Wave
As previously noted, the fundamental idea of Fourier analysis is that (nearly) every function, however complicated and discontinuous it might be, can be represented as a superposition of sine waves with fixed period or frequency, phase and amplitude.
Jean Baptiste Joseph Fourier (21st of March 1768 – 16th of May 1830) was the first who noted this remarkable phenomenon. After primary schooling Fourier proceeded in 1780 to the École Royale Militaire where his outstanding mathematical talents became obvious. Seven years later, he decided to train for the priesthood and entered a Benedictine abbey. Though, he continued his mathematical studies besides his religious education. In 1793 a third element entered his life, when he became involved in politics and joined the local Revolutionary Committee, but was appalled at the terror resulting from the French Revolution. He even got arrested as he defended moderated forces. After the execution of Robespierre the cruelties ebbed down, Fourier was set free and started his university studies in mathematics at the École Normale in Paris in 1795. Here he attended classes given by some of the most recognized mathematicians of his time. In 1797 he was appointed to the chair of analysis and mechanics at the École Polytechnique.
In 1798 Fourier joined Napoleon’s army in its invasion of Egypt as scientific adviser, where he helped founding the Cairo Institute and was elected as its secretary. After Napoleon’s defeat Fourier returned to France in 1801 and resumed his post as professor at the École Polytechnique. Fourier’s major mathematical interest was the conduction of heat and equilibration of temperature differences. In his work “Analytical Theory of Heat” he wrote
“Heat, like gravity, penetrates every substance of the universe, its rays occupy all parts of space. The object of our work is to set forth the mathematical laws which this element obeys. The theory of heat will hereafter form one of the most important branches of general physics.”
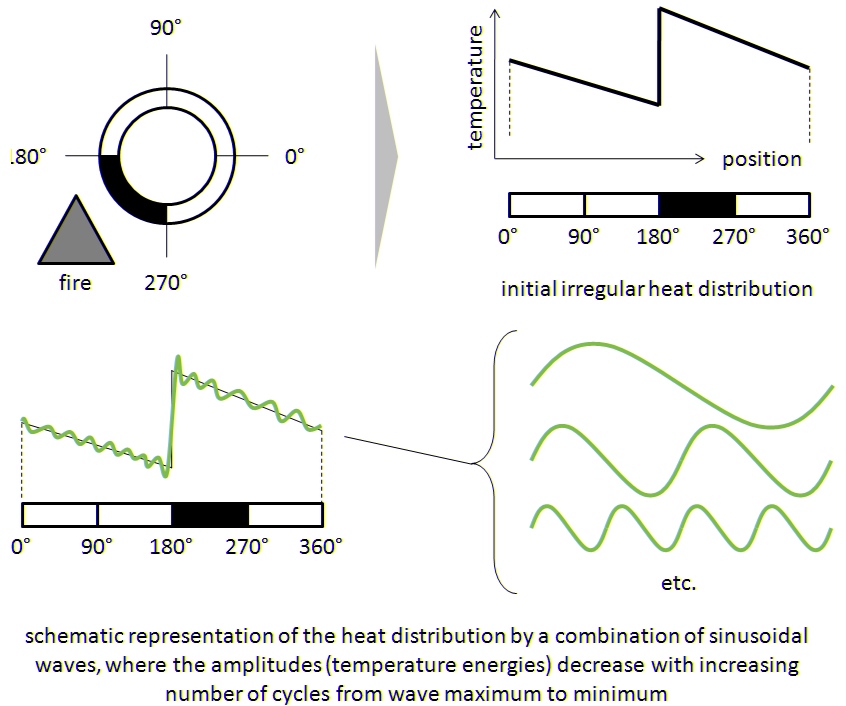
Fourier, for instance, considered the flow of heat around an iron anchor ring that has been thrust halfway into a fire, see [Bracewell, 1989]. When part of the circumference becomes red hot, the ring is withdrawn from the fire and, before much heat is lost, covered by fine sand. Now, the temperature distribution is measured, see figure 1.
Initially, the temperature is distributed irregularly around the ring: part of the ring is uniformly cold, and part of it is uniformly (red) hot; in between the temperature abruptly shifts (similar to the saw-tooth wave generated by playing a violin). As heat is conducted from the hot region to the cool region, however, sharp shifts vanish and the distribution begins to smooth out. Soon the heat distribution reaches a sinusoidal pattern – a plot of the temperature would rise and fall exactly in the way a sine function would vary. This sinusoid gradually flattens until the whole ring arrives at a constant temperature.
Fourier’s genius was to propose that the initial irregular distribution could be broken down into many simple sine waves that had their own maximum temperature (amplitude) and relative positioning around the ring (phase). Furthermore, each sine varied from its maximum to its minimum and back in an integral number of times in a single rotation around the ring. Hereby, the one-cycle variation became known as the fundamental harmonic, whereas variations with two, three or more cycles (periods) in a single rotation became the second, third and higher harmonics. In some sense, we can even compare his results successive approximation of a function by sinusoidal waves with the Ptolemaic method of epicycles to approximate the observed motion of celestial objects.
In particular, when applying his findings to the conduction of heat around the ring, Fourier reasoned that the greater the number of periods of his sine functions was, the more rapidly it decayed. Let us, for instance, consider the relation between the fundamental and the second harmonic of the heat distribution. The temperature of the second harmonic varies from hot to cold twice around the ring, whereas the fundamental varies only once. Therefore, the distance the heat must travel from hot peak to cold peak is only half as far for the second harmonic as it is for the fundamental variation. Furthermore, the temperature gradient in the second harmonic is twice as steep as the fundamental one. Because twice the heat flow occupies half the distance, the second harmonic will die out four times faster than the fundamental. Higher harmonics will decay even more rapidly. By the way, the same decay phenomenon can be observed when playing musical instruments, see, e.g., [Cheng et al., 2009].
Maybe next time, you or your spouse wear(s) an ear-ring, you might be reminded of the heat transition via a multitude of sine waves, smoothing the sharp temperature difference between the ring and the tip of the ear.
Figure 2 shows the somewhat inverse additive composition of sine functions until a predefined function is realized, in this case a discontinuous rectangle function. This example is particularly interesting as the rectangle wave has on a first glance nothing in common with the usual “round” illustrations of sine and cosine functions and their sums. Moreover, when inspecting the single figures (from upper left to lower right) that show the growth of the specific Fourier series, we can observe some tiny peaks appearing at the points of discontinuity. These extraneous peaks never disappear; they are termed Gibb’s phenomenon after the American physicist Josiah Willard Gibbs. They occur whenever the signal is discontinuous, and will always be present whenever the signal has jumps, see, e.g., [Gasquet et al., 1999]. Thus, up to these fragments at jumps any function should be equal to its Fourier series, in particular every continuous function should be?
It took until 1966 that Fourier’s claim, i.e., every continuous function equals the sum of its Fourier series, had been shown in a strict mathematical sense. The Swedish mathematician Lennart Carleson was able to prove that every continuous function equals the sum of its Fourier series “almost everywhere”, i.e., that the number of points where the Fourier representation of a sum of sine and cosine functions and the original function are not equal, is negligible. This statement is of significant importance for applications based on Fourier’s method; otherwise we would always be in doubt if what we are doing really works or if we are hunting ghosts. “For his profound and seminal contributions to harmonic analysis [this is how the study of Fourier series is called officially] and the theory of smooth dynamical systems”, Carleson was awarded the Abel Prize in 2006. This scientific prize, named in honor of the Norwegian mathematician Niels Henrik Abel (5th of August 1802 – 6th of April 1829), is the analogue to the Nobel Prize and endowed with approximately 6 million NOK (750’000 Euro). The Abel Prize is awarded annually and presented by the King of Norway since 2002 (see http://www.abelprisen.no/).
he reader is encouraged to compose her/ his own Fourier series. An excellent Fourier analysis applet is provided by Fu-Kwun Hwang on his web page http://www.phy.ntnu.edu.tw/ntnujava/index.php?topic=17 (NTNUJAVA Virtual Physics Laboratory, Java Simulations in Physics). Here, by defining the amplitudes of 16 sinusoidal functions sin(kf) and cos(kf), k = 0, 1, 2,…, 15, for a given base frequency f, one can compose an own Fourier series and play the sound this acoustic wave realizes. Another really great applet can be found at http://www.falstad.com/fourier/ on the pages of Paul Falstad.
Form Sound to Spectra – the Fourier Transform
We have just seen, the original time-based wave can be decomposed into a series of sinusoidal functions, each with a unique amplitude, frequency (i.e., number of cycles, or periods, per unit time) and phase. This process converts a rather complicated function over time (the heat or sound wave) into a more manageable sum of sine functions. Now we are considering the amplitude (and phase) of each sine term versus its frequency. This creates the power spectrum, which is the response of the original wave in the frequency domain. Figure 3 illustrates, this time to frequency domain conversion concept, for the technically easy example of our rectangle function. This conversion is called Fourier transform.
Of course, having a particular instrument, for instance the guitar, we can also assign its chords to a precisely defined power spectrum that enables us to differentiate the guitar from a violin. This sets the scene for a detective’s plot: Remember the Beatles “Hard Day’s Night” (1964) opening chord
“It’s been a hard day’s night
And I’ve been working like a dog”.
Everyone who tried to replay this sound by guitar would give up in desperation. How is that possible? About 40 years later Jason Brown of Dalhousie’s Department of Mathematics applied the Fourier transform to this problem. He discovered that the frequencies did not match the known instrumentation. “George played a 12-string Rickenbacker, Lennon had his six string, Paul had his bass […] none of them quite fit what I found,” he explains. “Then the solution hit me: it wasn’t just those instruments. There was a piano in there as well, and that accounted for the problematic frequencies.” (The discussion of the sound wave and its spectrum as well as some interviews in which Brown describes his discovery is provided at [Brown, 2004].)
Mathematically speaking, the Fourier transform is a function representing the amplitude and phase at each frequency. Thus, it is in general necessary to specify two numbers at each frequency, which can be expressed by a single complex number. (A complex number can be considered as the sum of a real number and another real number multiplied by the square root of negative one.) This representation is very popular as it invites the use of complex analysis (e.g., [Gasquet et al., 1999]). It is worth to note that the theory of complex analysis and the Fourier transform have become indispensible in the numerical calculations required to design electrical circuits, analyze mechanical vibrations and study wave propagation both in the macro as well as in the quantum cosmos ([Bracewell, 1989]).
Powerful techniques have been developed to handle the Fourier transform with more ease on a computer and gain speed compared to traditional methods. Hereby starting with a discretization of the time domain, i.e., instead of considering a wave over a continuously floating time you take the values of the wave over specifically chosen time points; just as a stroboscope would do with movements. (Similar discretization methods are the foundation of nearly any numerical algorithm and are, e.g., applied successfully in the design of new automobile components as well as in the design of space missions.) Again, these discrete values can be split into different components belonging to sine or cosine waves and can be carried over into the frequency domain. This procedure is known as discrete Fourier transform and, using a divide and conquer method dating back to Carl Friedrich Gauß in 1805, can be realized with impressive computational speed. One possible fast Fourier Transform was proposed by James Cooley and John W. Tukey in 1965, who showed that for N discrete points the algorithm requires about N*log(N) instead of the N*N arithmetical operations required for the usual discrete Fourier transform.
The Fourier Transform and Audio Devices
The transformation from the time domain to the frequency domain is reversible. Once the power spectrum is obtained the original signal can be reconstructed as a function of time computing the so called inverse Fourier transform.
This forms the basis for filtering of, e.g., noisy audio samples and the MP3 compression: Given a piece of music or the recording of a speech, we have already seen how to transform these waves to the frequency domain. Here, the magic happens – knowing the frequencies of the noise or those frequencies that cannot be heard by the human ear, we can simply erase them from the frequency representation. Now we can apply the inverse Fourier transform and gain a perfectly sounding result, or save the frequency representation, as MP3 does and “decode” it later on.
Compared to wav-format or normal audio recording the MP3 recording of the filtered frequency spectrum without all non-hearable frequencies does not affect the sound quality after applying the inverse transform. And since much less data needs to be stored this trick (together with a smart implementation) leads to a compression factor of 10:1 checked against the normal way.
Yet another application of the direct access to the underling spectrum is the synthesizer: Since we can decompose sounds in their individual parts, alter them in any way we like and put them together again. I.e., de-noise it, increase/ decrease the amplitude of some preferred frequencies or ad further frequencies to the spectrum. This is the theoretical foundation of the sound synthesizer. Around 1860, Hermann Ludwig Ferdinand von Helmholtz (31st of August 1821 – 8th of September 1894) invented the first acoustic-mechanical resonator, which could analyze and synthesize sound phenomena. The first Proto-Synthesizer was constructed.
Interestingly enough, after having analyzed the distribution of heat, the de-/ composition of sounds and rhythm as well as the filtering/ compression/ synthesizing of audio data, we are also prepared to analyze the DNA (see, e.g., [Bracewell, 1989]) or process images in order to detect cancer (see, e.g., [Beutel et al., 2000]), just by applying a mathematical idea about infinite sums of sine-waves.
Sources:
[Beutel et al., 2000] J. Beutel, M. Sonka, H. L. Kundel, J. M. Fitzpatrick and R. L. Van Metter (2000): Handbook of Medical Imaging: Medical image processing and analysis, volume 1 & 2, SPIE Press, Bellingham.
[Brown, 2004] J. Brown (2004): http://www.mathstat.dal.ca/~brown/AHDNjib.html
[Bracewell, 1989] R. N. Bracewell (1989): The Fourier Transform, Scientific American, June 1989, pp. 62-69.
[Cheng et al., 2009] X. Cheng, J. V. Hart and J. S. Walker (2009): Time-Frequency Analysis of Musical Rhythm, Notices of the AMS, 56(3), pp. 356-372.
[Gasquet et al., 1999] C. Gasquet, P. Witomski and R. Ryan (1999): Fourier Analysis and Applications. Filtering, Numerical Computation, Wavelets, Springer-Verlag, Berlin.
[NoiseAddicts, 2008] NoiseAddicts, the online music and audio magazine (2008): “Hard Day’s Night” Mystery chord solved using math, http://www.noiseaddicts.com/2008/11/beatles-hard-days-night-mystery-chord-solved/
[MacTutor, 2009] The MacTutor History of Mathematics archive, School of Mathematics and Statistics, University of St Andrews, Scotland,
http://www-groups.dcs.st-and.ac.uk/~history/BiogIndex.html
Nosto 1:
Fourier’s genius was to propose that the initial irregular distribution could be broken down into many simple sine waves that had their own maximum temperature (amplitude) and relative positioning around the ring (phase).
Nosto 2:
Next time, you or your spouse wear(s) an ear-ring, you might be reminded of the heat transition via a multitude of sine waves, smoothing the sharp temperature difference between the ring and the tip of the ear.


